What it costs a mutual fund company to run a fund. The expense ratio is calculated annually and includes management fees, administrative fees, and any marketing and distribution fees. It doesn't include loads or purchase or redemption fees, if any.
0.11%
as of 02/02/2026
This represents the total net assets for all share classes of Vanguard's U.S. funds that share the same investment strategy, management, and holdings, but does not include any collective trusts sharing the same investment mandate.
$28.8B
as of 10/31/2026
This figure represents the fund's total asset base, net of fees and expenses.
$13.2B
as of 10/31/2026
YTD RETURN
6.79%
as of 11/17/2026
BENCHMARK
FTSE US Choice Index
Overview
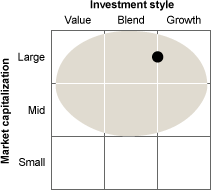
Vanguard FTSE Social Index Fund seeks to track the performance of a benchmark index that measures the investment return of large- and mid-capitalization stocks.
Investment approach
Seeks to track the performance of the FTSE US Choice Index.
Market cap weighted index composed of large- and mid-capitalization stocks.
Screened for certain environmental, social, and corporate governance (ESG) criteria.
Specifically excludes stocks of certain companies related to the following: adult entertainment, alcohol, tobacco, cannabis, gambling, chemical and biological weapons, cluster munitions, anti-personnel landmines, nuclear weapons, conventional military weapons, civilian firearms, nuclear power, and coal, oil, or gas.
Excludes stocks of companies that do not meet certain labor, human rights, environmental, and anti-corruption standards.
Excludes companies that do not meet certain diversity criteria.
Employs a passively managed, full-replication approach.
See Important note.
With respect to 75% of its total assets, the fund may not: (1) purchase more than 10% of the outstanding voting securities of any one issuer or (2) purchase securities of any issuer if, as a result, more than 5% of the fund’s total assets would be invested in that issuer’s securities; except as may be necessary to approximate the composition of its target index. This limitation does not apply to obligations of the U.S. government or its agencies or instrumentalities.
What it costs a mutual fund company to run a fund. The expense ratio is calculated annually and includes management fees, administrative fees, and any marketing and distribution fees. It doesn't include loads or purchase or redemption fees, if any. as of 02/02/2026
0.11%
YTD Returns (NAV) as of 11/17/2026
6.79%
30 day as of 10/31/2026
0.82% BASED ON HOLDINGS' YIELD TO MATURITY/DIVIDEND FOR LAST 30 DAYS OF PRIOR MONTH
as of 10/31/2026
0.94%
Inception date
02/07/2019
This represents the total net assets for all share classes of Vanguard's U.S. funds that share the same investment strategy, management, and holdings, but does not include any collective trusts sharing the same investment mandate.
$28.8B
This figure represents the fund's total asset base, net of fees and expenses.
$13.2B
Fund number
0513
CUSIP
921910717
Designation
Domestic Large Growth
Benchmark
FTSE US Choice Index
Fees & minimum
None
None
Minimum investment
$3.0 K
Performance
Total returns
What it costs a mutual fund company to run a fund. The expense ratio is calculated annually and includes management fees, administrative fees, and any marketing and distribution fees. It doesn't include loads or purchase or redemption fees, if any. :
0.11%
performance summary
performance summary
RECENT RETURNS
AVERAGE ANNUAL
Month-end
YTD
1 YEAR
3 YEAR
5 YEAR
10 YEAR
02/07/2019
VFTAX (NAV)
—
—
—
—
—
—
—
Spliced Social Index
—
—
—
—
—
—
—
The difference in a fund's non-fee adjusted return versus an identified benchmark or peer group.
—
—
—
—
—
—
—
Note: Except the most recent quarter, the expense ratios presented are the funds' actual operating expenses and they exclude any acquired fees and expenses, which result from the funds' holding in business development companies (BDCs). BDCs expenses are not direct costs paid by fund shareholders and are not used to calculate the funds' net asset value.
*Calvert Social Index through December 16, 2005; FTSE US Choice Index thereafter (formerly named the FTSE4Good US Select Index until February 5, 2024). The FTSE US Choice Index is maintained by FTSE, a widely known global index provider.
YEAR
1ST QUARTER
2ND QUARTER
3RD QUARTER
4TH QUARTER
Data not available for this Fund ID.
YEAR
Portion of a fund's return attributable to a fluctuation of its Net Asset Value (NAV).
Income return is the portion of total return that results from a periodic cash flow such as dividends.
Total return accounts for two categories of return: income and capital appreciation. Income includes interest paid by fixed-income investments, distributions or dividends. Capital appreciation represents the change in the market price of an asset.
Spliced Social Index
Data not available for this Fund ID.
AS OF
1 MONTH
3 MONTH
YTD AS OF
YTD AS OF
1 YEAR
3 YEAR
5 YEAR
10 YEAR
02/07/2019
VFTAX (NAV)
Spliced Social Index
Data not available for this Fund ID.
Quarterly commentary
For the three months ended September 30, 2026, U.S. stocks posted modest gains. Despite generally resilient economic growth and corporate earnings, persistently high inflation and rising interest rates weighed on investor sentiment.
Global stocks returned 1.19% for the period, as measured by the FTSE Global All Cap Index in U.S. dollars. Gains in the Pacific region and the U.S. more than offset declines in European equities.
The fund’s benchmark, the FTSE US Choice Index, returned 3.41% for the quarter. The Russell 3000 Index, which measures the broad U.S. stock market, returned 1.41%.
Technology (+7.3%), health care (+6.6%), and telecommunications (+1.5%) were the top contributors. They accounted for 65.4% of the index’s weighting at quarter-end and added about 4.3 percentage points to its result.
Consumer discretionary (–4.1%), industrials (–1.8%), and real estate (–4.8%) were the top detractors.
For the 12 months ended September 30, the index returned 15.91%. Technology (+30.4%), health care (+19.2%), and telecommunications (+13.2%) were the top contributors. Consumer discretionary (–8.7%), utilities (–6.4%), and energy (–20.6%) were the only detractors.
The performance data shown represents past performance, which is not a guarantee of future results. Investment returns and principal value will fluctuate, so that investors' shares, when sold, may be worth more or less than their original cost. Current performance may be lower or higher than the performance data cited.
Performance data for periods of less than one year does not reflect the deduction of purchase and redemption fees. Maintenance, low balance, and service fees may be assessed by some funds. None of these fees are reflected in the performance figures. If these fees were included, the performance would be lower. All other performance data are adjusted for purchase and redemption fees, where applicable.
The performance of an index is not an exact representation of any particular investment, as you cannot invest directly in an index. Benchmark comparative indexes represent unmanaged or average returns on various financial assets, which can be compared with funds' total returns for the purpose of measuring relative performance.
Price & Distributions
Closing price
Closing price as of
NAV
NAV change
52-week high
52-week low
52-week difference
Realized/Unrealized gains
as of
Realized gain
Distribution schedule
Quarterly
Unrealized gains of NAV
Fiscal year-end date
Distribution
Use this table to view or export up to ten years of distributions for this fund.
An indicator of the size of companies in which a fund invests; the midpoint of market capitalization (market price x shares outstanding) of a fund's stocks, weighted by the proportion of the fund's assets invested in each stock. Stocks representing half of the fund's assets have market capitalizations above the median, and the rest are below it.
—
—
Earnings growth rate
The average annual rate of growth in earnings over the past five years for the stocks in a portfolio.
—
—
P/E ratio
The share price of a stock divided by its per-share earnings over the past year. For a portfolio, the weighted average P/E ratio of the stocks in the portfolio. P/E is a good indicator of market expectations about a company's prospects; the higher the P/E, the greater the expectations for a company's future growth in earnings.
—
—
P/B ratio
The price per share of a stock divided by its book value (i.e., net worth) per share. For a portfolio, the ratio is the weighted average price/book ratio of the stocks it holds.
—
—
An indication of trading activity during the past year. Portfolios with high turnover rates incur higher transaction costs and are more likely to distribute capital gains (which are taxable to nonretirement accounts).
—
—
Return on equity
An amount, expressed as a percentage, earned on a company's common stock investment for a specific time frame. This figure tells shareholders how effectively their money is being utilized.
—
—
Foreign holdings
The percentage of a portfolio's investments represented by stocks or American Depository Receipts (ADRs) of companies based outside the United States.
—
—
Holdings details
As of date
This tab will first open a dialog to accept the terms and conditions.
No Holdings.
No Holdings.
No Holdings.
Sector categories are based on the Industry Classification Benchmark system (“ICB”), except for the “Other” category (if applicable), which includes securities that have not been provided an ICB classification as of the effective reporting period.
* Percentages may not add up to 100%. SEC regulations allow us to withhold a certain amount of holdings as proprietary information.
Weighted exposures
as of
Data not available for this Fund ID.
Sector categories are based on the Industry Classification Benchmark system (“ICB”), except for the “Other” category (if applicable), which includes securities that have not been provided an ICB classification as of the effective reporting period.
The composition of the portfolio's primary asset class. (i.e., for a bond fund, weighted exposures show the composition of the fund's bond allocation and will exclude other asset classes such as the short-term reserves).
Risk and volatility
as of
Risk and volatility
Data not available for this Fund ID.
Data not available for this Fund ID.
As with any investment, an investment in the fund could lose money over any time period. The fund’s share price and total return may fluctuate, potentially within a wide range. The principal risks of investing in the fund are summarized below. Each of the following risks could affect the fund’s performance:
ESG Investing. As described in the fund’s principal investment strategies, the index provider excludes certain securities from the target index based on ESG criteria. As a result, the fund’s investments could, in the aggregate, trail the returns of other funds that use ESG criteria or underperform the market as a whole. The index provider’s use of ESG criteria may result in the target index becoming focused, at times, in a particular market sector, which would subject the fund to proportionately higher exposure to the risks of that sector. Interpretations of what it means for a company or issuer to exhibit ESG characteristics can—and do—vary significantly across individuals, index providers, advisors, and other funds that use ESG criteria. The index provider’s assessment of whether or not a company or issuer meets the ESG criteria used to construct the target index, or the ESG criteria itself, may not align with your personal view of what it means for a company or issuer to exhibit ESG characteristics generally. Further, individual securities held by the fund may not reflect your personal preferences, beliefs, expectations, and/or values. In order to assess a company or issuer against the ESG criteria used to construct the target index, the index provider depends on the availability of data obtained through voluntary or third-party reporting. There can be no assurance that this data will be accurate, complete, or current, which could result in an inaccurate assessment of a company or issuer.
General Market Risk. The markets in which the fund invests can be affected by a variety of factors. These factors, which can be real or perceived, may include economic, market, political, and regulatory conditions and developments as well as local, regional, or global events such as wars, military conflicts, natural disasters, and public health issues. In addition, investor sentiment and expectations regarding these factors can also impact the markets. Different parts of the market, including different industries and sectors as well as different types of securities, may react differently to factors that affect the market. These factors can contribute to market uncertainty, market volatility, and fluctuations in the value of the fund’s investments, thereby resulting in potential losses to the fund over short or long periods.
Investing in Equity Markets. The fund invests in the equity markets. Equity markets have historically been cyclical, having periods of time when stock values rise and fall. Market volatility can lead to significant fluctuations in stock values, resulting in potential losses to the fund.
Market Capitalization (Market Cap). Companies are generally classified into three types of market cap depending on their size: small-, mid-, and large-cap. Companies can be further classified into micro- or mega-cap. Different factors can affect each market cap uniquely, and historically small-and mid-cap stocks have typically been more volatile due to the effects of changing economic conditions. Large companies may not reach the same levels of growth or performance as smaller companies, and they may be slower to react to competitive challenges. The performance of funds that invest in a subset of market caps could diverge from the performance of a fund that is focused on a broader representation of the stock market.
Index Investing. The fund is subject to risks associated with index investing. Because the fund generally seeks to track the performance of the target index regardless of how the target index is performing, the fund’s performance may be lower than it would be if it were actively managed. Although the fund seeks to hold substantially all of the securities included in the target index, it may be unable to do so. In addition, the fund could be prevented from holding one or more securities in the same proportion as in the target index. The performance of the fund’s investments, in the aggregate, may not match the investment performance of the target index. This risk, known as tracking error risk, may be heightened during times of increased market volatility or under other unusual market conditions. The fund also could be negatively impacted by changes to the target index made by the index provider or by errors made by the index provider. Any gains, losses, or costs associated with or resulting from an error made by the index provider will generally be borne by the fund and, as a result, the fund’s shareholders.
Nondiversification. By tracking its broad-based target index, the fund could become nondiversified, as defined under the Investment Company Act of 1940, due to events such as an index rebalance or market movement. The performance of nondiversified funds may be negatively impacted by relatively few securities or even a single security and their shares may experience significant fluctuations in value.
Concentration Risk. Except as may be necessary to approximate the composition of its target index, the fund will not concentrate its investments in the securities of issuers whose principal business activities are in the same industry or group of industries. If the target index becomes concentrated and the fund needs to concentrate in the same industry or group of industries, its performance could be negatively impacted by the industry or industries in which it is concentrated.
Information Technology Sector. As of the fund’s most recent fiscal year end, stocks of companies within the information technology sector made up a significant portion of the target index. As a result, the performance of the target index, and therefore the performance of the fund, may be impacted by the general condition of the information technology sector.
Management
Vanguard FTSE Social Index Fund seeks to track the performance of the FTSE US Choice Index, a market cap weighted index composed of large- and mid-capitalization stocks that is screened for certain environmental, social, and corporate governance (ESG) criteria by the index provider, which is independent of Vanguard. Specifically, the index excludes stocks of companies that FTSE Russell (FTSE) determines engage in, have a specified level of involvement in, and/or derive threshold amounts of revenue from certain activities or business segments related to the following: adult entertainment, alcohol, tobacco, cannabis, gambling, chemical and biological weapons, cluster munitions, anti-personnel landmines, nuclear weapons, conventional military weapons, civilian firearms, nuclear power, and coal, oil, or gas. The index methodology also excludes the stocks of companies that do not meet certain labor, human rights, environmental, and anti-corruption standards, as well as companies that do not meet certain diversity criteria. For additional details regarding the Index Methodology, please see the Methodology section of FTSE Group’s website for the FTSE US Choice Index. The Strategic Equity Index Management team applies sophisticated portfolio construction methodologies and efficient trading strategies designed to accommodate cash flows and maintain close alignment with benchmark characteristics. Vanguard’s refined indexing process, combined with low management fees and efficient trading, has provided tight tracking net of expenses.
Launched in 1975, The Vanguard Group Inc., Malvern, Pennsylvania, is among the world’s largest equity and fixed income managers. Vanguard’s wholly owned subsidiary, Vanguard Portfolio Management, an independent investment advisor designed to enhance fund oversight and operational efficiency, is focused on equity strategies. Equity index funds are managed by Strategic Equity Index Management, covering the U.S. market. Strategic Equity Index Management has developed sophisticated portfolio construction methodologies and efficient trading strategies that seek to deliver returns that are highly correlated with target portfolio benchmarks. The group has advised Vanguard FTSE Social Index Fund since 2000.
Aaron Choi, CFA,Portfolio manager.
Advised the fund since 2025.
Worked in investment management since 2015.
B.S., Pennsylvania State University.
M.B.A., The Wharton School of the University of Pennsylvania.
Chris Nieves, CFA,Portfolio manager.
Advised the fund since 2025.
Worked in investment management since 2013.
B.A., Cornell University.
MEng., Cornell University.
William Coleman, CFA,Portfolio manager.
Advised the fund since 2026.
Worked in investment management since 2006.
B.S., King's College.
M.S., Saint Joseph's University.
M.B.A., The Wharton School of the University of Pennsylvania.
Please refer to the Literature section below to access the Statement of Additional Information (SAI), which details the fund's approach to proxy voting.
Literature
Data is unavailable at this time. Please try again later.
Important Note: The index excludes the stocks of companies that FTSE determines engage in, have a specified level of involvement in, and/or derive threshold amounts of revenue from one or more of the following activities: (i) produce adult entertainment; own/operate adult entertainment establishments; distribute adult entertainment materials; (ii) manufacture alcoholic beverages; supply alcohol-related products/services to alcoholic beverage manufacturers; involved in distribution and/or retail sale of alcoholic beverages; (iii) manufacture tobacco products; supply tobacco related products/services; involved in distribution and/or retail sale of tobacco products; (iv) engage in cannabis cultivation, cannabis distribution, the processing and distribution of cannabis plants, and the creation of cannabis derivative products per the Industry Classification Benchmark (ICB) standards; (v) own and/or operate a gambling establishment; manufacture specialized equipment used exclusively for gambling; provide supporting products/services to gambling operations; (vi) produce chemical or biological weapons and their components; (vii) produce (or produce specific and critical parts or services for) cluster munitions; (viii) produce (or produce specific and critical parts or services for) anti-personnel mines; (ix) produce nuclear weapons or their components; (x) manufacture military weapons systems and/or integral, tailor-made components of these weapons; provide tailor-made products and/or services that support military weapons; provide non-weapons related tailor-made products and/or services related to the military or defense industry; (xi) produce and sell assault weapons or small arms to civilian customers; produce and sell key components of small arms; involved in the retail and/or distribution of assault weapons or small arms; (xii) involved in the operation and supply of nuclear power generation, that harnesses the energy present within atomic nuclei or their components; engaged in the development, processing, production and distribution of equipment and facilities that are specifically designed for and critical to the generation of nuclear power; (xiii) own proved or probable reserves in coal, oil, or gas; (xiv) any company that FTSE determines per the ICB standards: (a) engages in the exploration for and drilling, production, and supply of crude oil on land or in offshore areas; (b) primarily engages in the refining and marketing of petroleum products; (c) supplies equipment and services to oil fields and offshore platforms; (d) operates pipelines carrying oil, gas or other forms of fuel; (e) engages in all three fields of petroleum production: extraction (upstream), transportation (midstream), and refining and marketing (downstream); or (f) mines, processes and markets coal per the ICB standards; (xv) generate electricity from oil and/or gas, or thermal coal; and (xvi) distribute gas to end users. The level or type of involvement in, or amount of revenue earned from, certain activities or business segments that lead to exclusion by FTSE can vary from one activity or business segment to another. The index methodology also excludes the stocks of companies that, as FTSE determines based on its internal assessment, do not meet certain labor, human rights, environmental, and anti-corruption standards, as well as companies that fail to meet two of the following three diversity criteria: (1) at least one woman on the board; (2) diversity policies in place; and (3) diversity management systems in place. FTSE uses internal methodologies to analyze various factors in determining whether a company meets the foregoing criteria and/or falls within a particular industry, including whether the company has a certain amount of revenue derived from an industry, the company’s level of involvement in an industry, and the severity of certain controversies (as determined by FTSE), which can vary from one company to another and from one activity to another.



Quarterly commentary